Opensignal is out today with its latest in-depth report on 5G. The new data not only answers the question “where’s the fastest 5G in the US?” but also shows how much each state has improved, what availability is like, and more.
Opensignal shared the results of its latest US 5G study on its website today:
The 5G experience is changing rapidly in the U.S. as wireless carriers build out their 5G networks and expand the use of new 5G spectrum bands. In this insight we quantify how the 5G experience has changed across the U.S. in the six months since our previous analysis.
Notably, Opensignal says this report will serve as an important benchmark to see how AT&T and Verizon’s future 5G C-band deployments improve coverage going forward. For this study, Opensignal collected data from November 2021 through January 2022 across all 50 US states and 300 cities.
Where’s the fastest 5G in the US?
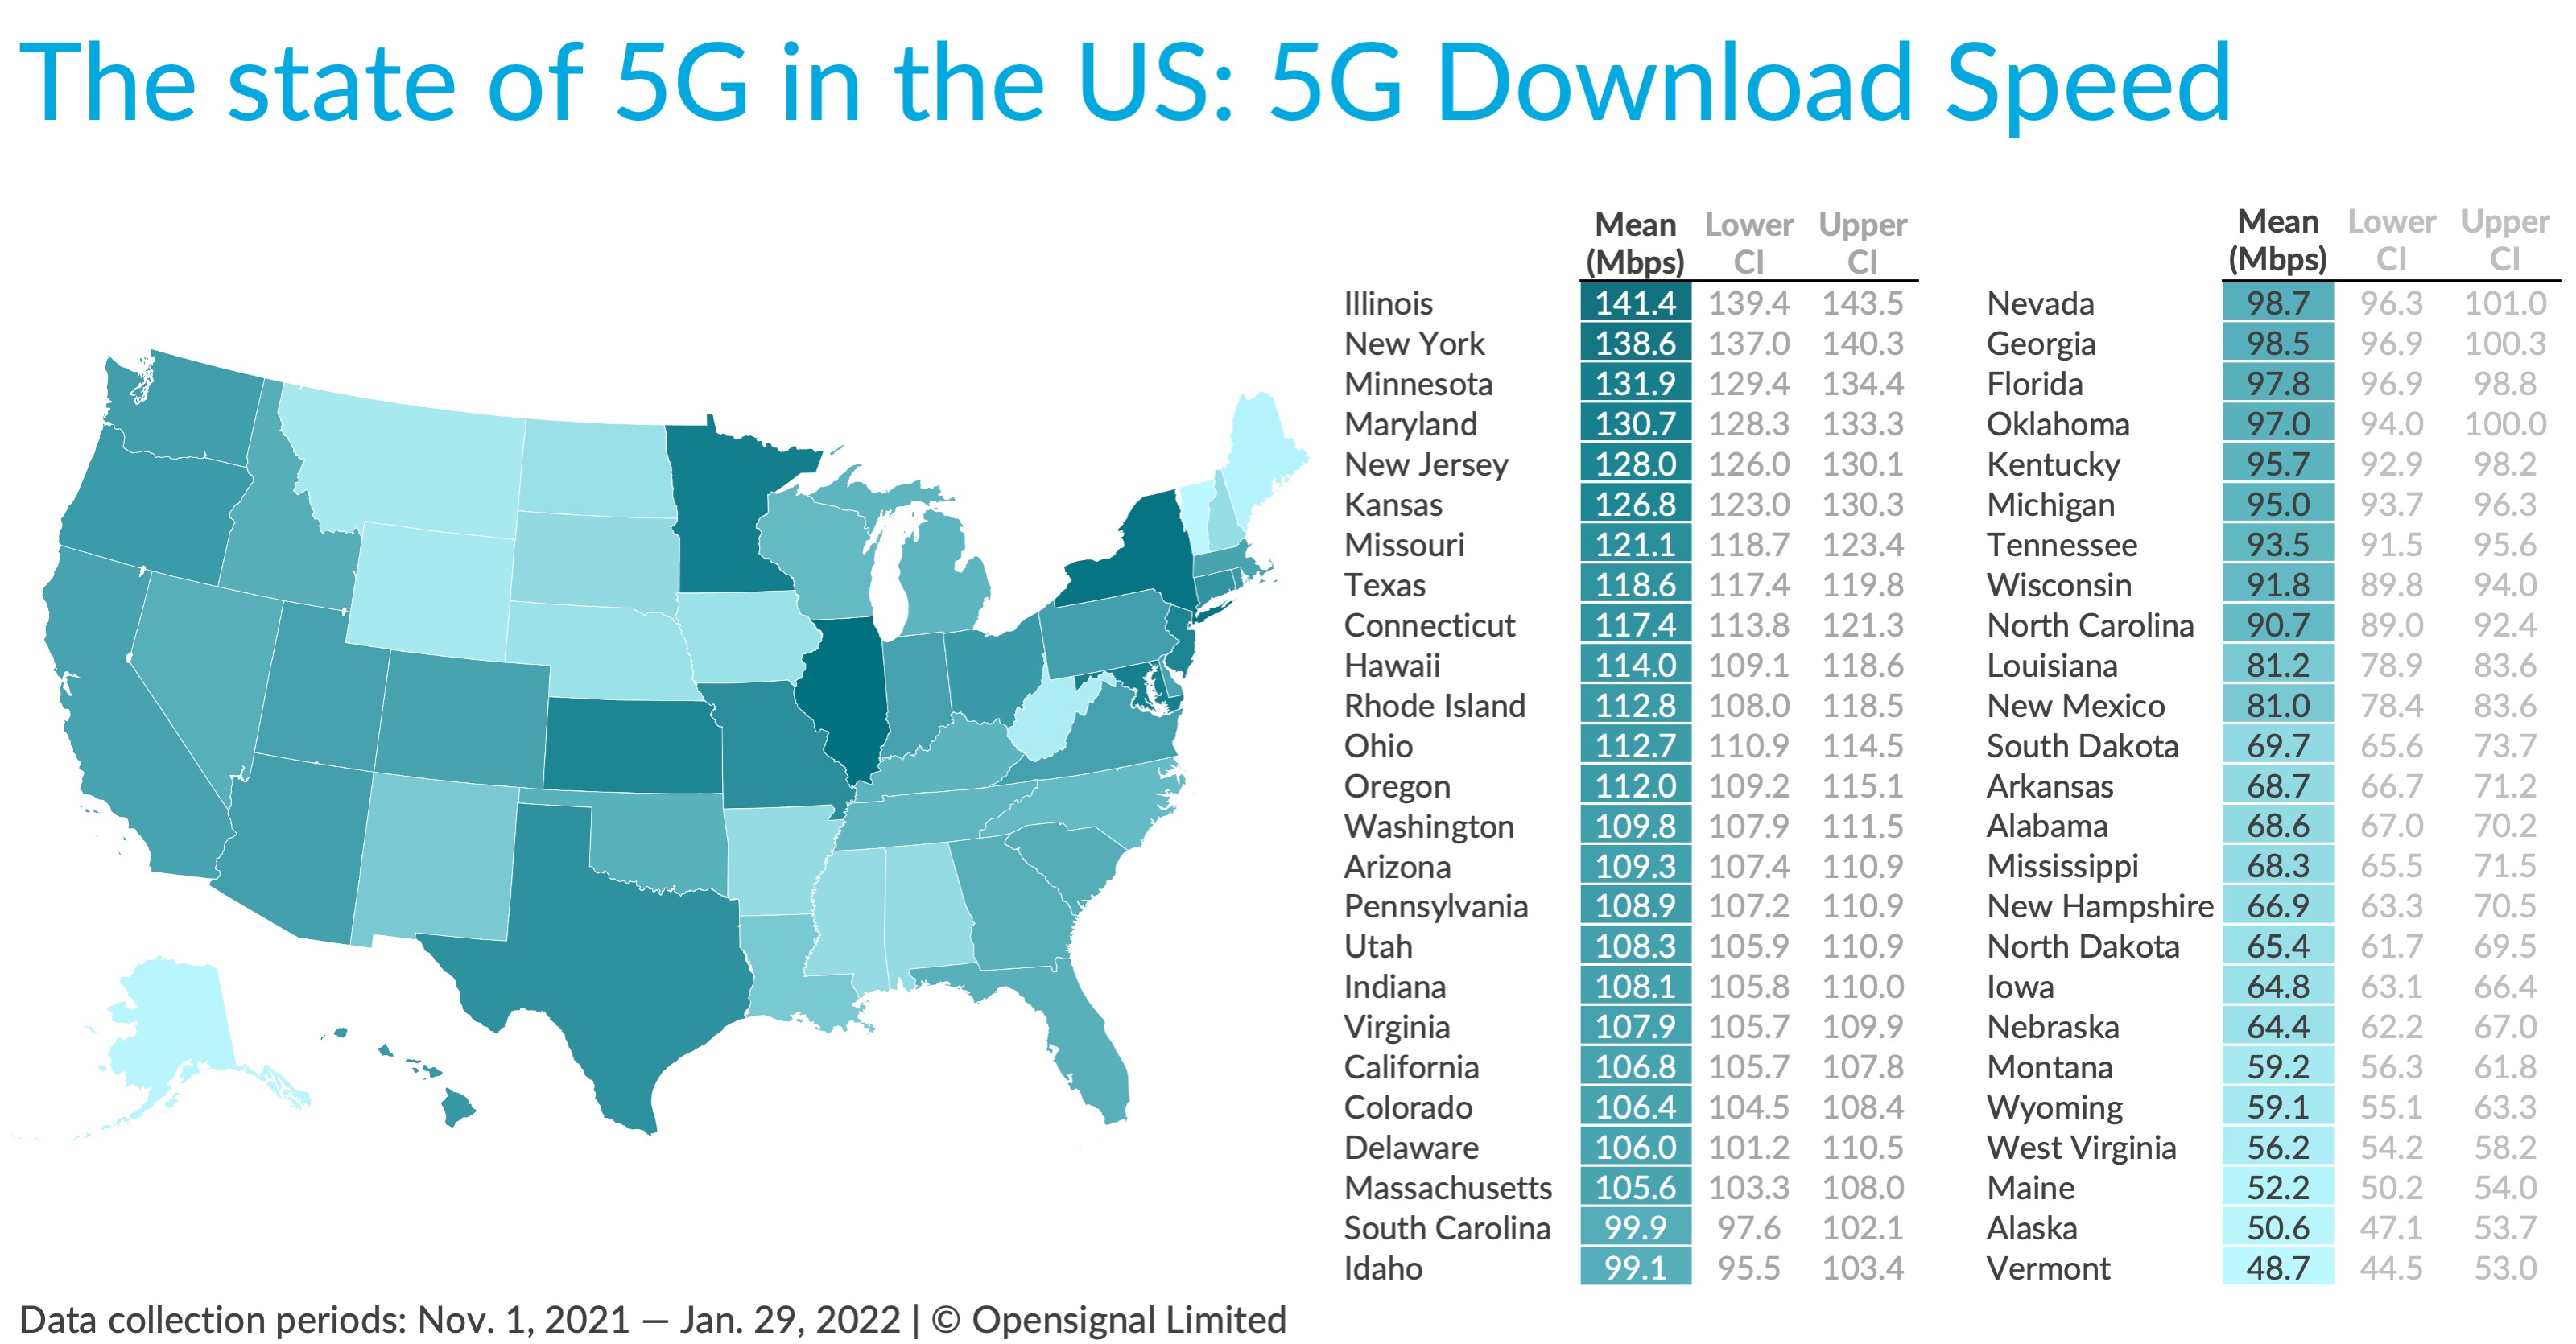
Illinois ranked number one with an average 5G download speed of 141.4 Mbps. Rounding out the top five were New York, Minnesota, Maryland, and New Jersey ranging from 128 to 138.6 Mbps.
Making up the bottom 5 were Wyoming, West Virginia, Maine, Alaska, and Vermont with the latter having an average 5G download speed of just 48.7 Mbps.
Here’s a look at how all 50 states stacked up:
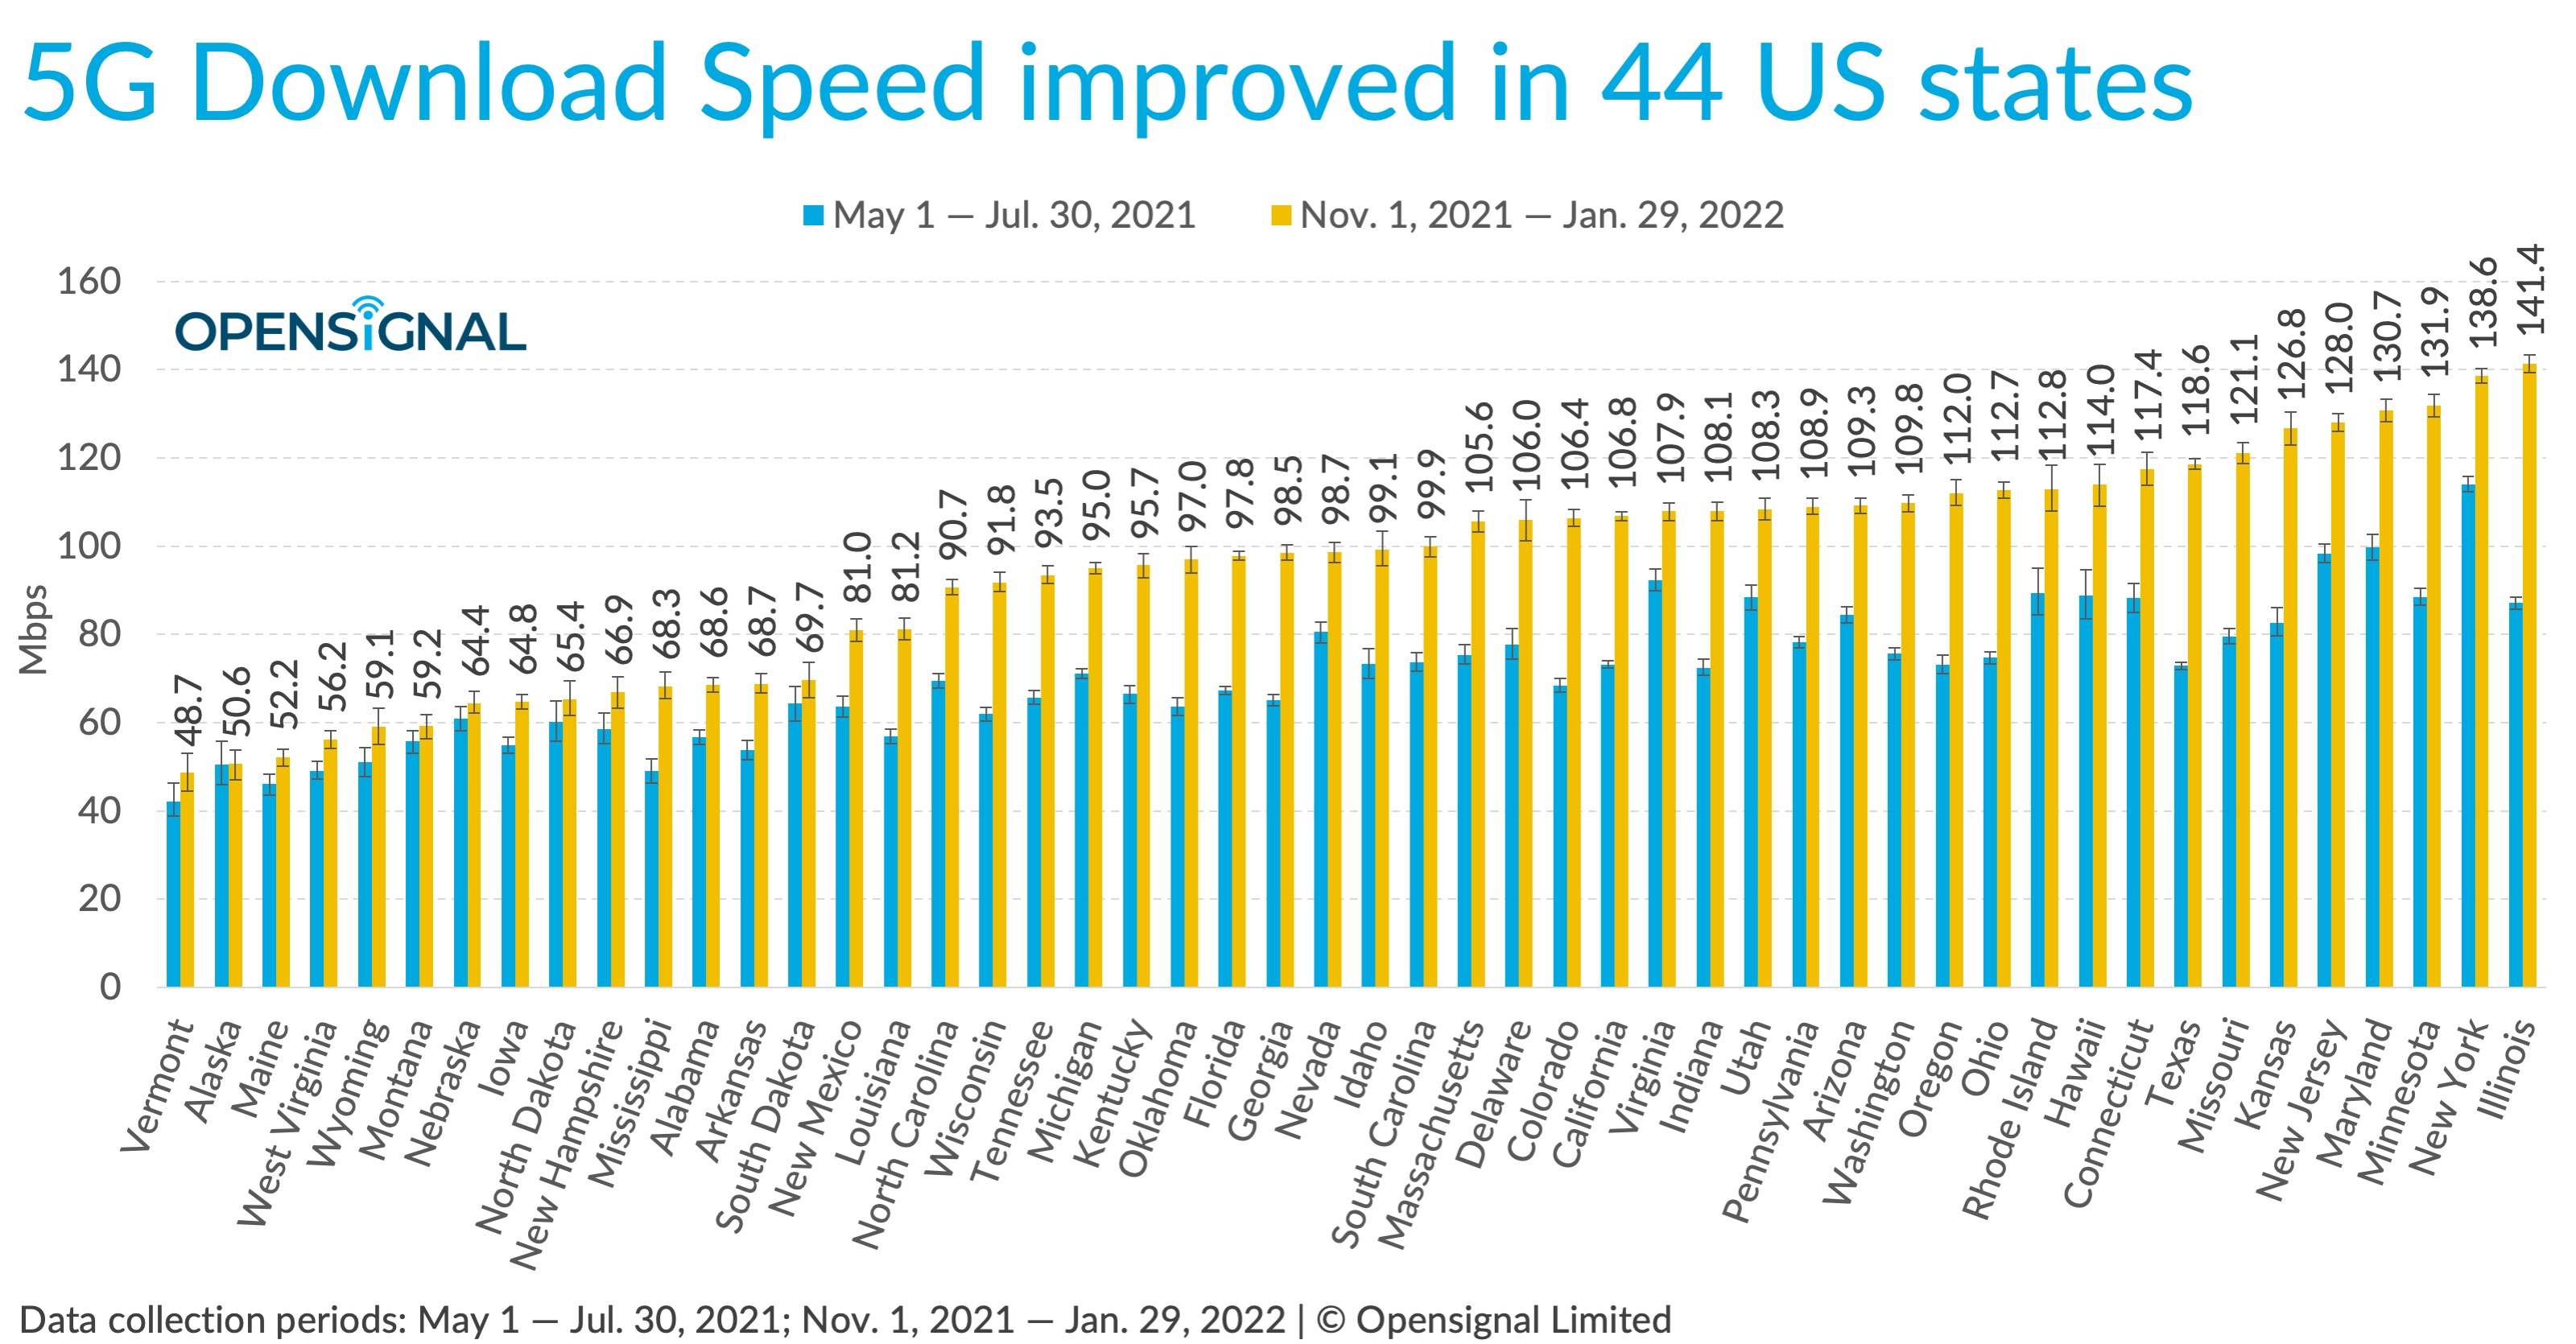
When it comes to improvement since May 2021, Opensignal says 44 states have seen an increase of 27 Mbps for their 5G average download speed.
However, the remaining 6 states: Alaska, Montana, Nebraska, North Dakota, South Dakota, and Vermont saw “no statistical change.”
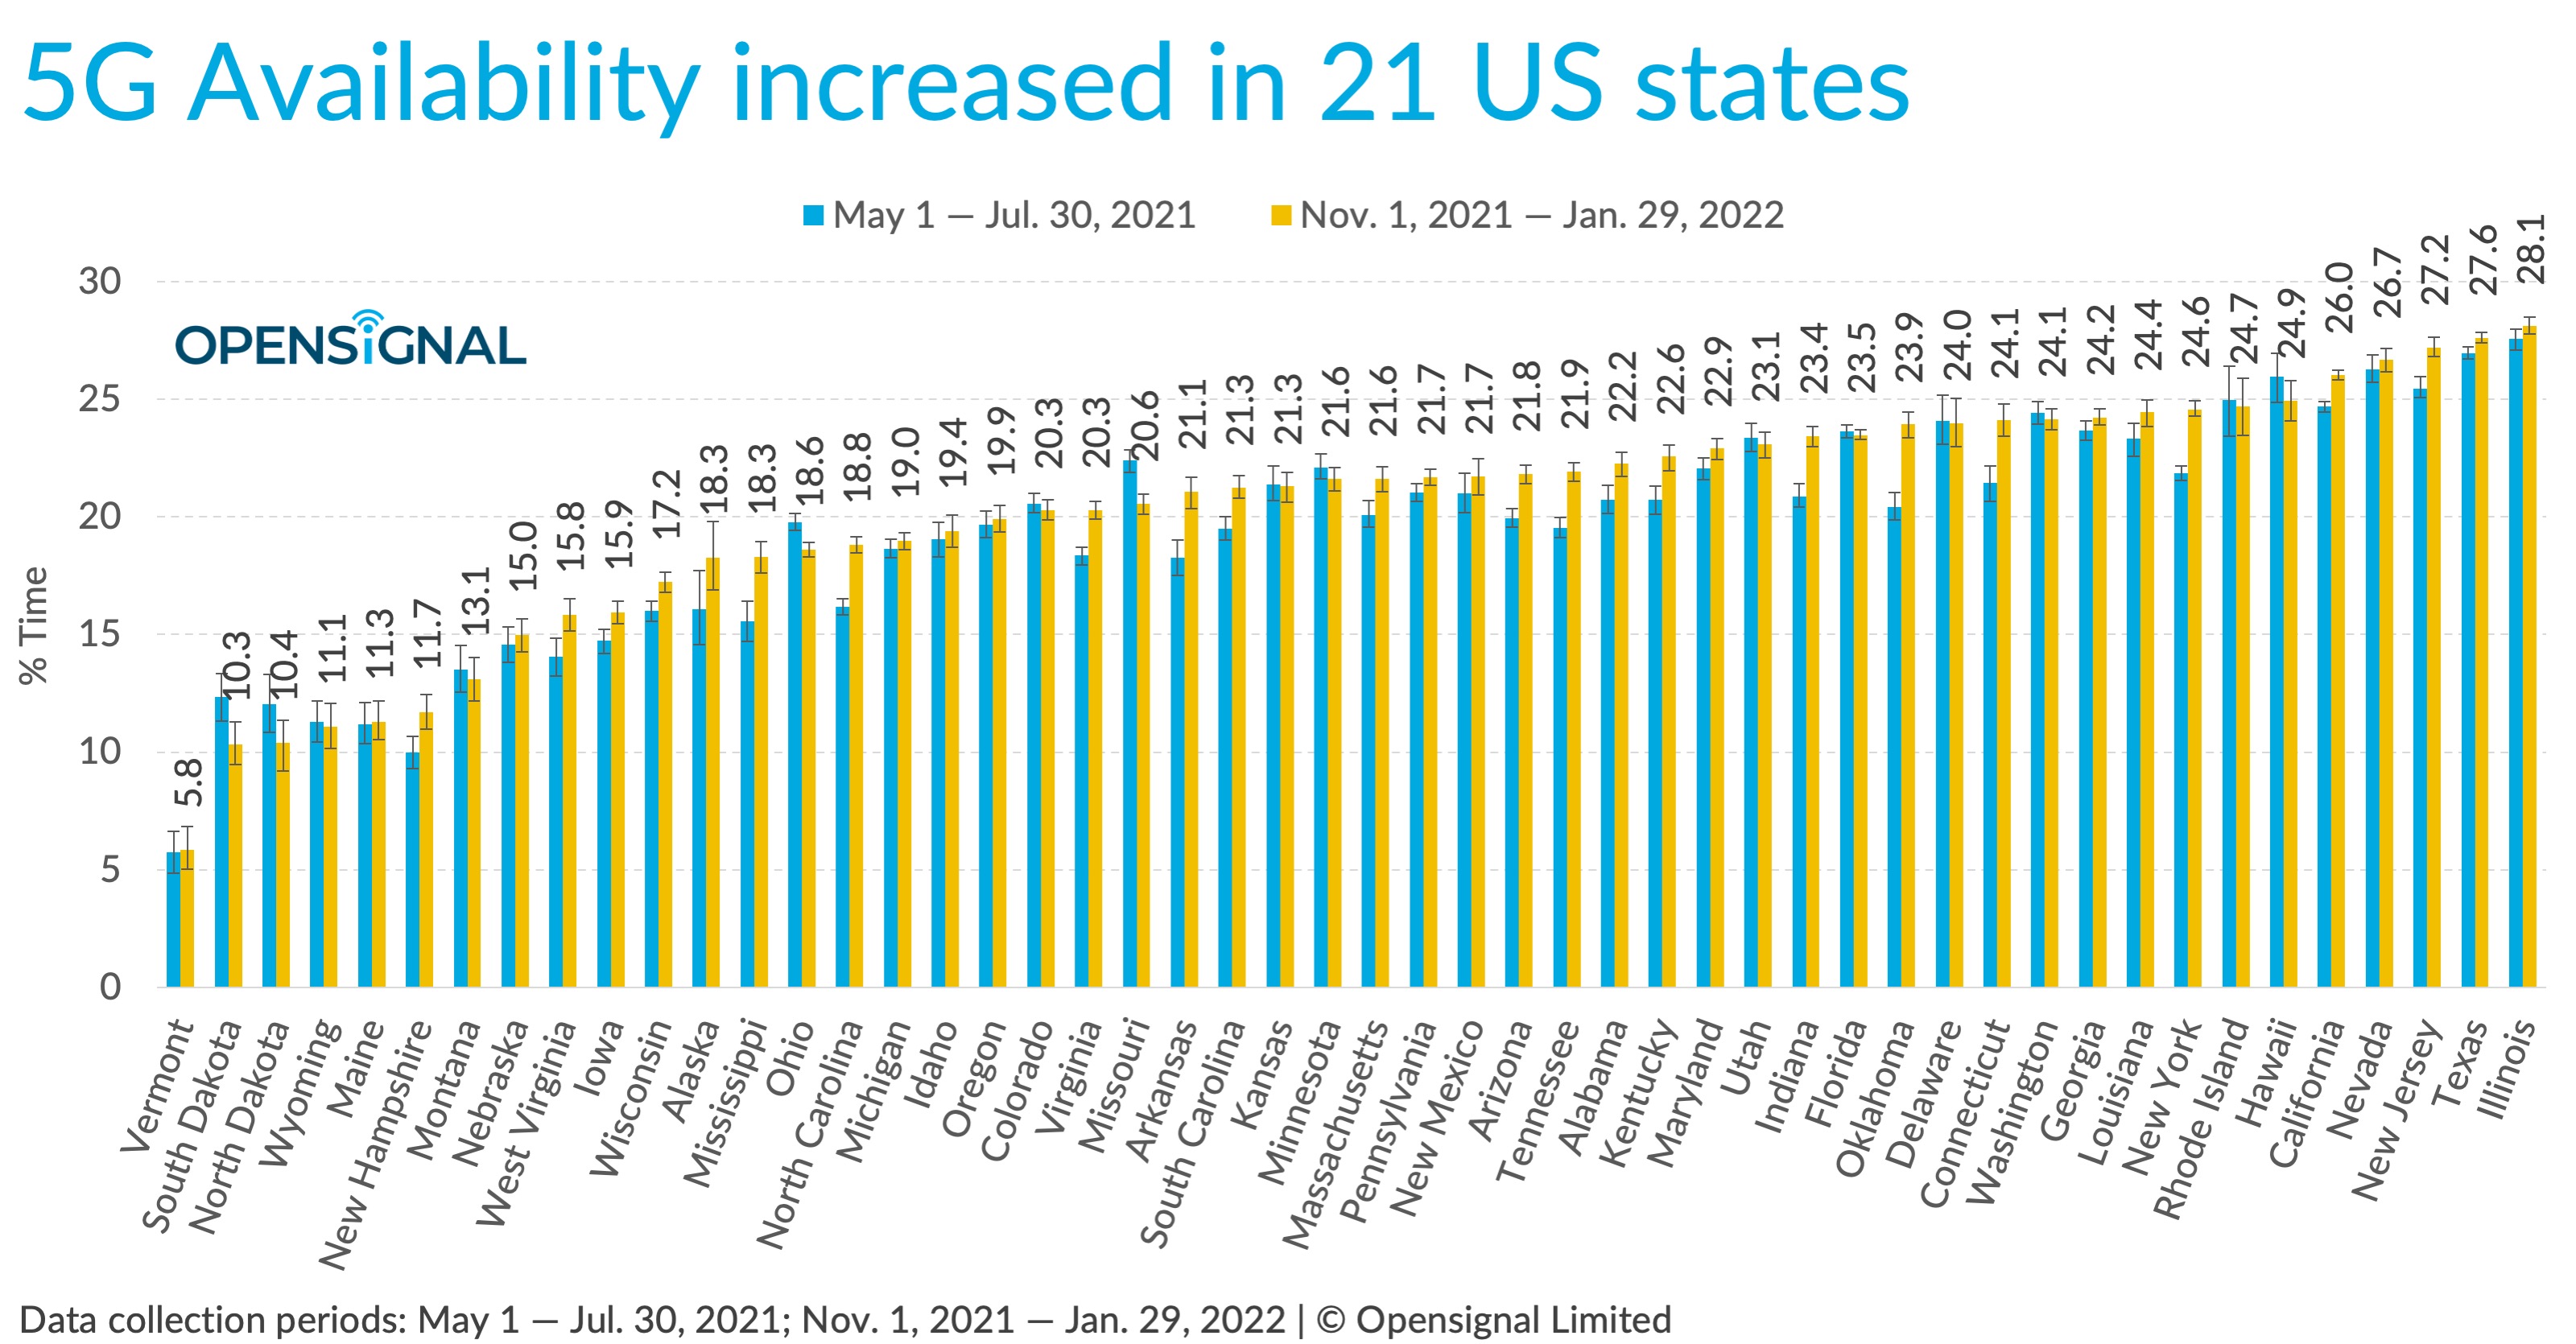
And for 5G availability, Opensignal says it was a mixed bag with improvement seen in 21 states but no meaningful change in 26.
While our 5G users were able to connect to 5G in more locations than ever before, that didn’t necessarily mean they also spent more time connected to 5G. Our data shows that 5G Availability improved in 21 states, while appearing statistically unchanged in 26 states, and even slightly decreased in the three remaining states of South Dakota, Missouri and Ohio. 5G Availability represents the proportion of time that 5G users saw an active 5G connection on their smartphone.
For even more details including regional/city data on 5G performance check out Opensignal’s full report here.
FTC: We use income earning auto affiliate links. More.



Comments